|
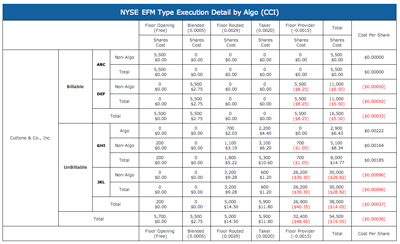
NYSE EFM Type Execution Detail by Algo
The NYSE EFM Type Execution Detail Analysis provides a summary view of the cost of trading activity for a given trade date or range of dates in NYSE and Amex listed stocks, including a "Cost Per Share" by EFM, that offers a concise data point to measure trading costs associated with each client. This Analysis presents the trading activity grouped into Billable and Non-Billable categories with each category sorted by Entering Firm Mnemonic, broken down by Algo, Non-Algo and Total shares and costs, and further classified into each NYSE trading fee category.
Benefit: Provides NYSE floor broker firms with a snapshot of the NYSE trading fees incurred for each EFM for NYSE listed share trading activity so that firms can recognize and track the net NYSE trading fees incurred for each of their billable and non-billable clients. The data can be used to manage NYSE trading fees on a client-by-client basis as needed, and provide insight into the trading activity undertaken for each client.

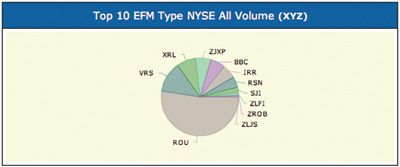
Top (10) EFM Type NYSE All Volume Pie Chart
The Top 10 EFM Type NYSE All Volume Pie Chart provides a graphic presentation of the percentage of total shares of NYSE listed stocks traded for a given trade date or range of dates sorted by the firm's top (10) EFMs for the period presented. Each pie "slice" is enhanced to present the number of shares traded and the percentage of the total shares of NYSE listed stocks traded for a specific EFM.

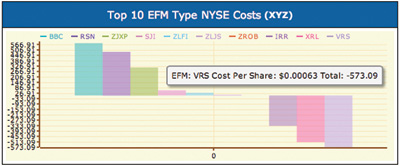
Top (10) EFM Type NYSE Costs Bar Graph Chart
The Top (10) EFM Type NYSE Bar Graph Chart provides a graphic representation of the total costs of trading for each of the firm's top 10 EFM's for a given trade date or range of dates.

Your Member Firm will also have access to the same EFM Execution Cost Analysis for AMEX trade data.
|


